
wOBA
Weighted On-Base Average (wOBA) is one of the most important and popular catch-all offensive statistics. It was created by Tom Tango (and notably used in “The Book”) to measure a hitter’s overall offensive value, based on the relative values of each distinct offensive event.
wOBA is based on a simple concept: Not all hits are created equal. Batting average assumes that they are. On-base percentage does too, but does one better by including other ways of reaching base such as walking or being hit by a pitch. Slugging percentage weights hits, but not accurately (Is a double worth twice as much as a single? In short, no) and again ignores other ways of reaching base. On-base plus slugging (OPS) does attempt to combine the different aspects of hitting into one metric, but it assumes that one percentage point of SLG is the same as that of OBP. In reality, a handy estimate is that OBP is around twice as valuable than SLG (the exact ratio is x1.8). In short, OPS is asking the right question, but we can arrive at a more accurate number quite easily.
Weighted On-Base Average combines all the different aspects of hitting into one metric, weighting each of them in proportion to their actual run value. While batting average, on-base percentage, and slugging percentage fall short in accuracy and scope, wOBA measures and captures offensive value more accurately and comprehensively.
Calculation:
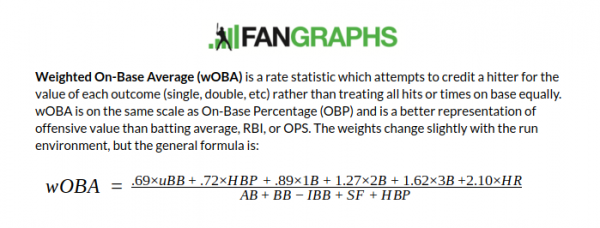
The wOBA formula for the 2013 season was:
wOBA = (0.690×uBB + 0.722×HBP + 0.888×1B + 1.271×2B + 1.616×3B +
2.101×HR) / (AB + BB – IBB + SF + HBP)
These weights change on a yearly basis, so you can find the specific wOBA weights for every year from 1871 to the present here.
To calculate wOBA, find the weights for the year you are interested in and multiply each weight by the player’s corresponding statistics. For example, in 2013 Mike Trout had 100 unintentional walks, 9 HBP, 115 singles, 39 doubles, 9 triples, and 27 home runs. If you multiple each by it’s corresponding weight and then divide that number by the sum of his at bats, walks (excluding IBB), hit by pitches, and sacrifice flies, you get .423, or his wOBA for the season.
Why wOBA:
One of the most common questions people ask when presented with a new statistic like wOBA is why they should use it when the basic triple slash line statistics (average, on base percentage, and slugging percentage) work just fine or work even better when using them to form OPS?
Simply put, OPS and wOBA will lead you to very similar conclusions in most situations, but if you care about determining how well a player contributes to run scoring, wOBA is a more accurate representation of that contribution. OPS undervalues getting on base relative to hitting for extra bases and does not properly weigh each type of extra base hit.
Additionally, individuals do not often calculate statistics by hand and will use a spreadsheet if they like doing it themselves or will make use of a website such as FanGraphs to provide that information. OBP or SLG might be easier to calculate with pencil and paper, but wOBA is extremely easy to find and use on our site, meaning any computational costs of moving to wOBA are minuscule.
How to Use wOBA:
One of the beauties of wOBA is that it is extremely easy to use once you learn the basics. League average wOBA is always scaled to league average OBP, so if you know what a good OBP is, you know what a good wOBA is. Below are specific averages for the current season, but typically an average hitter will finish the season with a wOBA of around .320.
wOBA is also quite easy to convert to Weighted Runs Above Average (wRAA), or the non-park adjusted version of Batting Runs. In other words, you can convert wOBA to a cumulative run value above average quickly. Simply take the player’s wOBA and subtract out the league average wOBA, then divide by the wOBA scale and multiple that by the number of plate appearances. Both league wOBA and the wOBA scale can be found here.
((wOBA-League wOBA)/wOBA Scale)*PA = wRAA
For example, Mike Trout had a .423 wOBA in 716 PA in 2013 and the league wOBA was .314 and the wOBA scale was 1.277.
((.423-.314)/1.277)*716 = 61.1 wRAA
In other words, before making park and league adjustments, Mike Trout’s was worth about 61 more runs than the average offensive player. You can’t make such an easy conversion using OPS.
A good rule of thumb is that 20 points of wOBA is worth about 10 runs above average per 600 PA. This is not a precise measurement and specific calculations are always better, but if you’re looking for an approximate rule of thumb, this may be useful.
Context:
Please note that the following chart is meant as an estimate, and that league-average wOBA varies on a year-by-year basis. It is set to the same scale as OBP, so league-average wOBA in a given year should be very close to the league-average OBP. To see the league-average wOBA for every year from 1901 to the present, check the FanGraphs leaderboards.
![]()
| Rating | wOBA |
| Excellent | .400 |
| Great | .370 |
| Above Average | .340 |
| Average | .320 |
| Below Average | .310 |
| Poor | .300 |
| Awful | .290 |

Things to Remember:
● This stat accounts for the following aspects of hitting: unintentional walks, hit-by-pitches, singles, doubles, triples, home runs. Stolen-bases and caught stealing numbers used to be included as well on FanGraphs, but they are now instead accounted for with the stats UBR and wSB. This way, wOBA only accounts for a player’s production at the plate.
● Exactly how much to weigh each of the components of wOBA was determined using linear weights.
● wOBA can be converted into offensive runs above average easily. These are called Weighted Runs Above Average (wRAA). The formula to convert wOBA into wRAA is listed below:
wRAA = ((wOBA – league wOBA) / wOBA scale) × PA
(league-average wOBA can be found here; wOBA scale values can be found here)
● This stat is context-neutral, meaning it does not take into account if there were runners on base for a player’s hit or if it was a close game at the time.
● wOBA on FanGraphs is not adjusted for park effects, meaning that batters that play in hitter-friendly parks will have slightly inflated wOBAs.
Custom wOBA and Linear Weights for 1871-2010 – Beyond the Box Score
Calculating wOBA (Datebasa Version) – The Book Blog
A Visual Look at wOBA – FanGraphs
Intro to wOBA – Big League Stew
Getting to Know wOBA – The Book Blog
The History of wOBA – The Book Blog
wOBA Calculator – New English D
Piper was the editor-in-chief of DRaysBay and the keeper of the FanGraphs Library.
Heads up, the link to the wOBA calculator is broken (delete the “0” after “spreadsheets” in the URL).
Besides that, this entire saber library is amazing work, Steve.
Thanks…it should be fixed now. Hopefully that works.
Works great. wOBA, the on base average that matters.
It could be user error, but I believe the “calculator” is view-only.
All right, it’s public on the web now. The only trick is if you want to edit it, you need to save your own copy and do it that way. I want to make sure the formula stays intact and it doesn’t get changed by accident.
I’m still having some difficulty with this. It doesn’t look like it’ll let me save it…
Haha, dang, why do I suck so much at this? Now it’s public and anyone can edit. Hopefully that does the trick.
Yeah it’s working, except now it looks like if there is more than one person viewing the document, that they can potentially both be punching in their own numbers at the same time.
Geez. Okay, I’ll mess around with it some tonight.
No sweat. Looking forward to having that here though
Oooo. A fourth tier of responses. Should be global.
Apologies if I’m being a bit lazy, cause I’m sure this answer is somewhere in this excellent library, but why are HBP weighted more than NIBB (.75 v .72)?
HBPs have a slightly better linear weighting than do NIBBs. The reason for this is that pitchers have somewhat more control over NIBBs, and thus they are more frequent in those situations in which their impact is somewhat lessened (e.g., runners on second and/or third, first base open) and less frequent when their impact is greatest (e.g., bases loaded).
Excellent, thank you
a HBP also mens that the pitcher is more likely to be wild.
The 25th percentile wOBA is really only .004 below the 50th percentile, but the 75th percentile is .045 above? It doesn’t make intuitive sense that such a large number of players would be bunched just below the 50th percentile but not just above it.
This graph is for WAR, but the same general concept is the same. There’s a big bunch of mediocre players once you get to a certain level.
http://assets.sbnation.com/assets/483944/war_distro_2010.jpg
Also, this is why I call these “estimates”. Technically the 50th percentile is a bit higher than what’s listed, but I wanted to express the mean instead of the 50th percentile. Makes it a tad weird.
I don’t see in player’s stats the number of times they reached base on an error.
Where can one find the Reached on Error stats for individual players?
Perhaps I missed something but I did my own calculation for a specific player, Ian Kinsler, and came out a little off. Do the linear weights change from year to year?
Q#1: why is this called weighted-onbase-AVERAGE? This is not an average.
If this is an average, what does 1.000 represent (other than awesome!)? what does Ellsbury’s 0.402 2011 wOBA mean? he’s just over 40% of what?
Q#2: Who came up with the name? Do you really think people want to use this in public (man, have you seen his woba)?
I love the stat itself. Love the concept. And what you guys have done to provide us with great tools for analysing players performances, but Im not going to use a stat that sounds like a drunk jedi knight (Obi-woba kenobi?)
Q#3: why is this matched up to look like OBP numbers? Isnt this a kind of replacement for slugging% (which also isnt a percentage)?
what is the fascination with creating new stats and then trying to make them look like other stats? I believe the idea is that your afraid if you keep creating new stats with new numbers, we’ll get fed-up. We’re baseball-fanatics… we’ll never get fed-up of these numbers! I think the opposite has happened, as I for one don’t like viewing a new stat that just hides itself behind the appearance of an old one. Give them there own individual look and they’ll be more widely accepted.
Im currently taking your wOBA results and multipling them by 1.4271886648681 (as close as I can get it without knowing ‘reached base on error’ results) so that 1.000 matches up with the greatest single season performance ever – Babe Ruth in 1921 – and Ive called the stat BRaverage (pronounced brave-erage), meaning the Babe Ruth average. The numbers now have a meaning. How close is the player to the greatest ever season? Jacoby Ellsbury? in 2011 scored 0.574 in BRaverage.
Of course, using Babe Ruths 1921 season is just an example, but my point is, lets make these stats express a point, have some kind of scale that we understand… And a name we can all pronounce (publically and literally) – though BRaverage could also be shortened to BRA, which might be even more publically embarrassing… have you seen Prince Fielders BRA?
I am happy when reading your blog with updated information! thanks alot and hope that you will post more site that are related to this site.
oakley sunglasses prescription
hank you for an additional fantastic blog. Where else might one get that sort of
information written in such a perfect way? I actually have a presentation that i am
presently working on, and that i are looking for such information instead
Cheap Oakley Glasses .
I don’t understand why wOBA doesn’t consider intentional walks. It’s especially confusing since hit by pitch is considered. I’d think if HBP is factored in, so would intentional walks. What am I missing?
my guess would be because IBB are from your teammates putting the other team in position where it is better to put you on base, and this is supposed to try to determine what an individual is doing at the plate by himself.
But then HBP and reaching on an error shouldn’t count either. (which they probably shouldn’t.)
I was a major STAThead back in the late 80s and early 90s before it became semi-mainstream thanks to Internet and Moneyball. Just getting back into it. I developed my own metrics in the past and wonder why some stats are included/excluded here. Maybe I just haven’t thought it through:
Why is RBOE relevant? If the player “should” have been out, why reward him? That may be useful for comparing projected versus actual run totals for past seasons, but it does nothing for player evaluation or projecting the future.
SF should have some value if a HBP has more value than a NIBB. As it is a byproduct of a situational at bat just as a NIBB might be.
SH is and should be excluded as that is an extreme situation just as a IBB.
Why do all these metrics ignore SB and CS? They are readily available offensive stats and quite meaningful for a handful of players.
Why are Ks and GIDP excluded? They should both have a negative value.
The only rationale for excluding the above I can see is that the wOBA is simply an attempt to combine two imperfect stats (OBP and SLG). Why not go the extra step and create a single number that estimates the total offensive value of a hitter…
Since the formula does not give any credit for intentional walks, shouldn’t you divide by plate appearances minus intentional walks instead of just dividing by plate appearances? Otherwise you are actually punishing a batter who gets intentionally walked. Or am I missing something?
I think this is actually making a non-negligible difference in the Trout/Cabrera comparison.
I am surprised that HBP are weighted higher than walks in the formula, since getting beaned is more a function of luck than drawing a walk. True, some guys get beaned more, but it’s not a repeatable skill like walking is.
Your blog is useful information and article posting regularly of your site.
The problem with most of these ‘Complex Statistics’ is that they weight them based on their correlation with runs. Sure that sounds great in theory, but the reality is you can go 100 for 100 with 100 triples and not score a run. You could also go 1 for 100 with one single and score a run. Correlating events to runs scored (the most important thing an offense can do) is probably the most irrelevant statistic you can have, when it comes to an individual. Statisticians continually turn a blind eye to this. It does not matter what events correlate to runs scored because unless you hit a homerun, you do not control whether or not you score. Furthermore, wOBA is either underweighting extra base hits, or overweighting singles. According to wOBA 10 for 10 with 10 singles is better than 7 for 10 with 7 doubles. I’ll take 7 for 10 with 7 doubles all day. Not only do I have 4 more total bases (14 to 10). I also am likely to have more runs batted in. As if that was not enough, I have a runner in scoring position 7 more times (7 to 0). I like where wOBA tries to go, but until run correlation is thrown out, it will be fundamentally flawed.
I’m no expert on all this, but from what I understand, the constants that they use in the wOBA formulation relates to the expected value, in terms of runs, that results from each type of hit, during each season. Taking what you aptly noted in the beginning, those 7 doubles could result in less runs happening when compared to those 10 singles. Extrabases mean nothing if the players behind you don’t drive you or, or if the players ahead of you don’t get on base (or are slow on the bases). The constants in the equation accounts for all those situations that occurred during that season.
You say that run correlation does not matter. What this tries to encapsulate is the reality for that season: how often do runs score when there is a particular offensive event. Yes, only a homer is where a batter controls whether a run scored, but baseball is a team game, not an individual one. And using your logic, 10 singles or 7 doubles, that is less in your estimation than a hitter who hits 1 homer in 10, making outs the other 9 times. Is that really what you think? I don’t think you do, but that is what I got.
Apologies if I’m being a bit lazy, cause I’m sure this answer is somewhere in this excellent library, but why are HBP weighted more than NIBB (.75 v .72)?
Dunhill has decided to phase out this pack and have introduced marketing information that the blue box described below is the same cigarette although carbon monoxide levels and nicotine levels are altered. dunhill cigarettes
I need to know why, for example, a BB is worth .69, a HBP is worth .72, a 1B is worth .89, etc. How do you figure the value of each of the ways to get on base? I understand why more value is placed on a home run than a walk, but where do you come up with the numerical value?
Perhaps I missed something but I did my own calculation for a specific player, Ian Kinsler, and came out a little off. Do the linear weights change from year to year?
If a player has more than an 83.3% K rate, does it really make sense for them to have a defined NOC+? With the current wOBA weights, that’s the threshold at which the deficit to get back to a league average hitter is mammoth enough that even if they hit a home run in every non-strikeout PA, there simply aren’t enough of those PAs to make up the missing value.