Sign In
  • Support FanGraphs
    FanGraphs Membership
    Gift a Membership
    Donate to FanGraphs
    FanGraphs Store
  • Games
    Ottoneu Fantasy Baseball
    Signup, FAQ, Blog Posts
  • Blogs
    Blog Roll

    FanGraphs
    Podcasts: FanGraphs Audio | Effectively Wild | Chin Music

    FanGraphs Prospects

    RotoGraphs
    Podcasts: The Sleeper and The Bust | Field of Streams | Beat the Shift

    Community Research

    Archived Blogs: The Hardball Times | NotGraphs | TechGraphs | FanGraphs+
    Archived THT: THT Live | Dispatch | Fantasy | ShysterBall
    Archived Podcasts: Stealing Home | Doing It For Bartolo | OttoGraphs | UMP: The Untitled McDongenhagen Project
  • Projections
    2021 Pre-Season Projections
    ZiPS, ZiPS DC
    Steamer
    Depth Charts
    ATC
    THE BAT, THE BAT X
    2021 600 PA / 200 IP Projections
    Steamer600
    2021 Updated In-Season Projections
    ZiPS (RoS), ZiPS (Update)
    Steamer (RoS), Steamer (Update)
    Depth Charts (RoS)
    THE BAT (RoS), THE BAT X (RoS)
    3 Year Projections
    ZiPS 2022, ZiPS 2023
    Auction Calculator
    Auction Calculator (New Interface)
  • Scores
    Today
    Live Scoreboard, Probable Pitchers
    Live Daily Leaderboards
    Win Probability & Box Scores
    2021, 2020, 2019, 2018, 2017...
  • Standings
    2021 Projected Standings
    2021 Playoff Odds, Playoff Odds Graphs
    ZiPS Postseason Game-By-Game Odds
    AL East
    AL Central
    AL West
    NL East
    NL Central
    NL West
  • Leaders
    Major League Leaders
    Batting: 2021, 2020, 2019, 2018, Career
    Pitching: 2021, 2020, 2019, 2018, Career
    Splits Leaderboards
    Season Stat Grid
    60-Game Span Leaderboards (Special)

    KBO Leaders
    Batting, Pitching

    Minor League Leaders
    AAA: International, Pacific Coast, Mexican
    AA: Eastern, Southern, Texas
    A+: California, Carolina, Florida State
    A: Midwest, South Atlantic
    A-: New York-Penn, Northwest
    R: Appalachian, Gulf Coast, Pioneer, Arizona
    R: Dominican
    Legacy Minor League Leaderboards

    WAR Tools
    Combined WAR Leaderboards
    WAR Graphs
    WPA Tools
    WPA Inquirer
    Rookie Leaders
    Batters 2021, Pitchers 2021
    Splits Leaders
    Batters: vs L, vs R, Home, Away
    Pitchers: vs L , vs R, Home, Away
  • Teams
    Team Batting Stats
    2021, 2020, 2019, 2018, 2017...
    Team Pitching Stats
    2021, 2020, 2019, 2018, 2017...
    Team WAR Totals (RoS)
    AL East
    Blue Jays  |  DC
    Orioles  |  DC
    Rays  |  DC
    Red Sox  |  DC
    Yankees  |  DC
    AL Central
    Cleveland  |  DC
    Royals  |  DC
    Tigers  |  DC
    Twins  |  DC
    White Sox  |  DC
    AL West
    Angels  |  DC
    Astros  |  DC
    Athletics  |  DC
    Mariners  |  DC
    Rangers  |  DC
    NL East
    Braves  |  DC
    Marlins  |  DC
    Mets  |  DC
    Nationals  |  DC
    Phillies  |  DC
    NL Central
    Brewers  |  DC
    Cardinals  |  DC
    Cubs  |  DC
    Pirates  |  DC
    Reds  |  DC
    NL West
    D-backs  |  DC
    Dodgers  |  DC
    Giants  |  DC
    Padres  |  DC
    Rockies  |  DC
    Positional Depth Charts
    Batters: C, 1B, 2B, SS, 3B, LF, CF, RF, DH
    Pitchers: SP, RP
  • RosterResource
    Current Depth Charts
    AL East
    Blue Jays
    Orioles
    Rays
    Red Sox
    Yankees
    AL Central
    Cleveland
    Royals
    Tigers
    Twins
    White Sox
    AL West
    Angels
    Astros
    Athletics
    Mariners
    Rangers
    NL East
    Braves
    Marlins
    Mets
    Nationals
    Phillies
    NL Central
    Brewers
    Cardinals
    Cubs
    Pirates
    Reds
    NL West
    D-backs
    Dodgers
    Giants
    Padres
    Rockies
    In-Season Tools
    2021 Closer Depth Chart
    2021 Injury Report
    Offseason Tools
    2021 Opening Day Tracker
    2021 Offseason Tracker
    2021 Free Agent Tracker
  • Prospects
    Prospects Home
    THE BOARD!
    THE BOARD: Scouting + Stats!
    How To Use THE BOARD: A Tutorial
    Top Prospects List
    Top Prospects
    2021 2020
    AL
    BALCHWHOU
    BOSCLELAA
    NYYDETOAK
    TBRKCRSEA
    TORMINTEX
    NL
    ATLCHCARI
    MIACINCOL
    NYMMILLAD
    PHIPITSDP
    WSNSTLSFG
    AL
    BALCHWHOU
    BOSCLELAA
    NYYDETOAK
    TBRKCRSEA
    TORMINTEX
    NL
    ATLCHCARI
    MIACINCOL
    NYMMILLAD
    PHIPITSDP
    WSNSTLSFG

    • 2021 Preseason Top 100


    • 2020 Preseason Top 100

  • Glossary
    Library
    Batting Stats
    wOBA, wRC+, ISO, K% & BB%, more...
    Pitching Stats
    FIP, xFIP, BABIP, K/9 & BB/9, more...
    Defensive Stats
    UZR Primer, DRS, FSR, TZ & TZL, more...
    More
    WAR, UBR Primer, WPA, LI, Clutch
    Guts!
    Seasonal Constants
    Park Factors
    Park Factors by Handedness
  • Sign In
Help Support FanGraphs


Become a Member No Thanks
Already a member? Log In
  • Intro
  • Features
  • Offense
    • Complete List (Offense)
    • OBP
    • OPS and OPS+
    • wOBA
    • wRC and wRC+
    • wRAA
    • Off
    • BsR
    • UBR
    • wSB
    • wGDP
    • BABIP
    • ISO
    • HR/FB
    • Spd
    • Pull%/Cent%/Oppo%
    • Soft%/Med%/Hard%
    • GB%, LD%, FB%
    • K% and BB%
    • Plate Discipline (O-Swing%, Z-Swing%, etc.)
    • Pitch Type Linear Weights
    • Pace
  • Defense
    • Overview
    • Def
    • UZR
    • DRS
    • Defensive Runs Saved – 2020 Update
    • Inside Edge Fielding
    • Catcher Defense
    • FSR
    • RZR
    • TZ / TZL
  • Pitching
    • Complete List (Pitching)
    • ERA
    • WHIP
    • FIP
    • xFIP
    • SIERA
    • Strikeout and Walk Rates
    • Pull%/Cent%/Oppo%
    • Soft%/Med%/Hard%
    • GB%, LD%, FB%
    • BABIP
    • HR/FB
    • LOB%
    • Pitch Type Linear Weights
    • SD / MD
    • ERA- / FIP- / xFIP-
    • Plate Discipline (O-Swing%, Z-Swing%, etc.)
    • Pace
    • PITCHF/x
      • What is PITCHF/x?
      • Pitch Type Abbreviations & Classifications
      • Heat Maps
      • Common Mistakes
      • PITCHf/x Resources
  • WE/RE/LI
    • RE24
    • Win Expectancy
    • WPA
    • LI
    • WPA/LI
    • Clutch
  • Principles
    • DIPS
    • Regression toward the Mean
    • Replacement Level
    • Sample Size
    • Splits
    • Projection Systems
    • Linear Weights
    • Counting vs. Rate Statistics
    • Park Factors
    • Park Factors – 5 Year Regressed
    • Positional Adjustment
    • Aging Curve
    • League Equivalencies
    • Pythagorean Win-Loss
    • Luck
  • WAR
    • What is WAR?
    • WAR for Position Players
    • WAR for Pitchers
    • FDP
    • fWAR, rWAR, and WARP
    • WAR Misconceptions
  • Business

xFIP

by Piper Slowinski
February 15, 2010

xFIP Flash Card 12-29-15

Expected Fielding Independent Pitching (xFIP) is a regressed version of Fielding Independent Pitching (FIP), developed by Dave Studeman from The Hardball Times. It’s calculated in the same way as FIP, except it replaces a pitcher’s home run total with an estimate of how many home runs they should have allowed given the number of fly balls they surrendered while assuming a league average home run to fly ball percentage (between 9 and 10% depending on the year).

Home run rates are generally unstable over time and fluctuate around league-average, so by estimating a pitcher’s home run total, xFIP attempts to isolate a player’s ability level. A pitcher may allow home runs on 12% of their flyballs one year, then turn around and only allow 7% the next year. HR/FB ratios can be very difficult to predict because they contain a lot of noise, so xFIP attempts to correct for that and provide you with a sense of the pitcher’s underlying performance.

To learn more about why we’re interesting in Defense Independent Pitching Statistics (DIPS), check out our primer on FIP. This entry will walk you through the benefits of xFIP, assuming you have a basic understanding of DIPS and FIP.

Calculation:

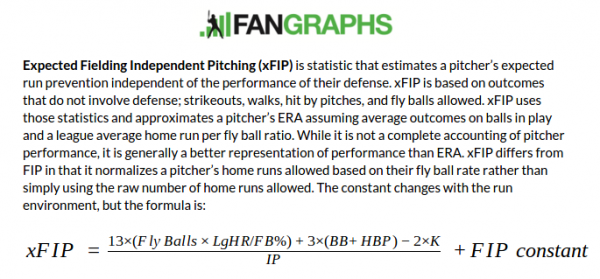
Here is the full formula for xFIP. Notice how it is almost exactly the same as the formula for FIP, with the lone difference being how each accounts for home runs. In traditional FIP, you would use the pitcher’s home run total, but in xFIP, you derive an expected number of home runs by taking the pitcher’s fly balls allowed multiplied by the league average home run per fly ball rate. League average HR/FB% is available here and only dates back to 2002.

xFIP = ((13*(Fly balls * lgHR/FB%))+(3*(BB+HBP))-(2*K))/IP + constant

The constant is solely to bring FIP and xFIP onto an ERA scale and is generally around 3.10. You can find historical FIP constants (which is the same as the xFIP constant) values here, or you can derive the constant yourself. Because FIP is designed so that league average ERA and league average FIP are the same, to find the constant for any year, all you need to do is the following:

FIP Constant = lgERA – (((13*lgHR)+(3*(lgBB+lgHBP))-(2*lgK))/lgIP)

Knowing how to calculate the constant can be especially useful if you’re interested in doing some of your own calculations for data spanning multiple seasons. The individual weights for home runs, walks/HBP, and strikeouts are based on the relative values of those actions with respect to run prevention.

Why xFIP:

While the value of moving from ERA to FIP is that it attempts to strip out defense, luck, and sequencing, moving from FIP to xFIP is useful because it tries to remove some of the randomness in the pitcher’s actual performance. Everything we do to calculate FIP is based on the idea that the pitcher is responsible for strikeouts, walks, hit batters, and home runs while the defense is not. This makes FIP a better indicator of pitcher performance than ERA.

However, we also know that the number of fly balls that go for home runs is very sensitive to sample size meaning that over the course of a season, the number of home runs a pitcher allows may be higher or lower than their true talent indicates. This is not to say pitcher’s aren’t responsible for the home runs they did allow, but rather to say that if you want to judge about how well they pitched, xFIP will remove some of those fluctuations in HR/FB% and will give you a better idea. For this reason, our pitcher Wins Above Replacement (WAR) is based on FIP rather than xFIP. They gave up the home runs so they count against them, but xFIP suggests they probably won’t continue to do so in the future.

To give you an idea, let’s imagine a pitcher who threw 200 innings, struck out 200, walked and hit 60, gave up 24 home runs, and 240 fly balls. This pitcher would have a FIP of 3.56 (if we assume a 3.10 FIP constant). This pitcher has a league average HR/FB%, so we can also say their xFIP is 3.56.

Now imagine if during the course of this season, this pitcher allowed five more home runs to carry the fence. That’s not even one extra home run per month.That turns into a 3.89 FIP, but the pitcher’s xFIP remains 3.56. In the first scenario, the pitcher has a 10% HR/FB% and in the second scenario it’s 12%. That may not seem like a big gap, but it is. And we also know that these rates are not typically very stable over time, which means that there is an awful lot of random noise involved. When discussing a pitcher’s past value, those home runs should count against them, but if you want to evaluate their underlying performance, knowing their fly ball rate is more useful.

As a result, xFIP strips out some of this fluctuation to give you a better view of how well we think a pitcher pitched over a given period of time, while controlling for defense, batted ball luck, and sequencing, and also HR/FB%. In other words, we use xFIP to see how a pitcher might be expected to perform given an average HR/FB% because we do not expect pitchers to have much control over that number. They can control how many fly balls they allow, but only a limited set of pitchers can truly influence their HR/FB%. This makes xFIP a very useful statistic if used properly.

How to Use xFIP:

Using xFIP is both extremely easy and moderately complex. From a simple perspective, xFIP is on an ERA scale, so you can apply what you know about ERA and FIP to xFIP and have a good sense of what a given value means. A player with a 3.00 xFIP is just as good as you think a player with a 3.00 ERA is. The scale is intentionally identical, so reading xFIP is a snap.

Using it appropriately when analyzing players requires a bit more caution. First, it’s not as simple as saying Pitcher A has a 3.40 ERA and FIP and a 3.70 xFIP, so he is due for regression. While xFIP is usually more predictive of future performance, there are reasons why a pitcher might not be expected to pitch to that particular xFIP.

First, some pitchers can control their HR/FB% to some degree. Generally speaking, we expect most pitchers to approach a league average rate (About 10% most years), but some pitchers can consistently posts values around 8% and some can go as high as 12%. This is different than saying HR/FB% bounces around based on random variation. Some pitchers do the the ability to limit their HR/FB%, so being aware of your particular pitcher’s skill set is important. If a pitcher has routinely posted 9% HR/FB%, there’s a decent chance xFIP is underrating him a bit.

Additionally, xFIP is a predictive model based on just one year of data or however many years you incorporate and every event is weighted equally. In this way, it is not better than a legitimate effort to forecast or project a pitcher’s ERA or FIP. You can think of it as a very basic forecast, but a proper forecast will include multiple years of data and will weight recent events differently than older events.

Despite it’s limitations in those two regards, xFIP is a terrific way to get a sense of how well a pitcher’s been throwing the ball. xFIP tells us about a pitcher’s strikeout and walk rates, which are very important, and also inherently provides us with information about their batted ball profiles because fly ball rate is built into the model.

In a very simple sense, FIP tells you how a pitcher has performed (value) independent of their defense while xFIP tells you about how well he has pitched (ability, talent) independent of their defense. Do not rush to assume a pitcher’s xFIP is a better reflection of their talent, but using it to get a sense of their abilities in conjunction with other statistics will make you much better off.

Context:

Please note that the following chart is meant as an estimate, and that league-average xFIP varies on a year-by-year basis so that it is always the same as league-average ERA. To see the league-average xFIP for every year from 1901 to the present, check the FanGraphs leaderboards.

Rating FIP
Excellent 2.90
Great 3.20
Above Average 3.50
Average 3.80
Below Average 4.10
Poor 4.40
Awful 4.70


Things to Remember:

● xFIP is not park or league adjusted. We carry a park and league adjusted version called xFIP-, found in the “Advanced” tab of the leaderboards and player pages.

● xFIP only dates back to 2002, the first year we have reliable HR/FB% data. Sorry, you can’t find Sandy Koufax’s xFIP.

● While HR/FB ratios are generally unstable over time, some pitchers are still more prone to allowing home runs than others. If a pitcher has a long history of over- or under-performing the league average with their HR/FB rate, then you can reasonably expect them to perform closer to their career average than the league-average. In cases like this, xFIP may overestimate or underestimate a player’s true talent level by assuming a league average HR/FB ratio. For more, see SIERA.

● Ground ball pitchers typically have higher HR/FB ratios than fly ball pitchers.

● xFIP has one of the highest correlations with future ERA of all the pitching metrics.

● While xFIP is more predictive than FIP, we use FIP to build WAR because those home runs were the responsibility of the pitcher and not the defense, which WAR hopes to strip out.

Links for Further Reading:

Batty for Baseball Stats – Hardball Times

Better with Less: ERA Estimators – Baseball Prospectus

Bannister Touts xFIP – Kansas City Star

xFIP Calculator – New English D


FIP
 
UZR

Piper was the editor-in-chief of DRaysBay and the keeper of the FanGraphs Library.

19
Leave a Reply

Please Login to comment
10 Comment threads
9 Thread replies
0 Followers
 
Most reacted comment
Hottest comment thread
14 Comment authors
Adam WeinbergerJames GentileJohnXtremeline BaseballFredM Recent comment authors
newest oldest most voted
Nadingo
Guest
Nadingo
You can flag a comment by clicking its flag icon. Website admin will know that you reported it. Admins may or may not choose to remove the comment or block the author. And please don't worry, your report will be anonymous.

Quick note on this:

“- Similarly, groundball pitchers typically have a higher homerun rate than flyball pitchers.”

I understand what you’re saying there — that groundball pitchers have higher HR/FB rates than flyball pitchers (due I think to the fact that their flyballs are more often the result of bad pitches). But the term “homerun rate” is potentially ambiguous if read out of context, as someone might think you were saying that groundball pitchers give up more home runs (per nine innings) than flyball pitchers do.

P.S. This dictionary idea is awesome! I especially like the percentile tables.

Vote Up2Vote Down 
10 years ago
Piper Slowinski
Author
Piper Slowinski
You can flag a comment by clicking its flag icon. Website admin will know that you reported it. Admins may or may not choose to remove the comment or block the author. And please don't worry, your report will be anonymous.

Great call, I’ll clarify. I feel like “homerun rate” looks less weird to people than HR/FB rate, but it can be confusing especially in this instance. Many thanks.

Vote Up0Vote Down 
10 years ago
Jon
Guest
Jon
You can flag a comment by clicking its flag icon. Website admin will know that you reported it. Admins may or may not choose to remove the comment or block the author. And please don't worry, your report will be anonymous.

Wait, doesn’t xFIP taken into account flyball percentage? Thus a pitcher with a 5 K/9, 3 BB/9, and a 48 FB% will have a higher xFIP than a pitcher with a 2 K/9, 3 BB/9, and a 40 FB%

Vote Up0Vote Down 
10 years ago
Piper Slowinski
Author
Piper Slowinski
You can flag a comment by clicking its flag icon. Website admin will know that you reported it. Admins may or may not choose to remove the comment or block the author. And please don't worry, your report will be anonymous.

Nope, it only considers walks, strikeouts, and HR/FB rate….and the HR/FB rate is regressed to league-average for all players.

tERA and SIERA (BPro) are the two pitching stats that include batted ball data.

Vote Up0Vote Down 
10 years ago
Josh
Guest
Josh
You can flag a comment by clicking its flag icon. Website admin will know that you reported it. Admins may or may not choose to remove the comment or block the author. And please don't worry, your report will be anonymous.

According to the calculator link, what Jon says is true. FB%*.106 gets you the expected HR portion.

Could you add the formula to this post (I see it on FIP, but not xFIP)?

Vote Up0Vote Down 
10 years ago
Piper Slowinski
Author
Piper Slowinski
You can flag a comment by clicking its flag icon. Website admin will know that you reported it. Admins may or may not choose to remove the comment or block the author. And please don't worry, your report will be anonymous.

Ahh bugger, yeah, right. I saw Dave Cameron address it in the chat this morning, and you’re right…FB% is included to help you get the expected HR portion. So Jon, you were basically right…FB% is included and helps get the expected HR portion of xFIP.

I would hesitate to say that Jon’s above example is correct without running it through the calculator, though…it all depends on the relative weights of each section. But yeah, sorry Jon…good catch all around.

Vote Up0Vote Down 
10 years ago
Jon
Guest
Jon
You can flag a comment by clicking its flag icon. Website admin will know that you reported it. Admins may or may not choose to remove the comment or block the author. And please don't worry, your report will be anonymous.

Yeah I asked Dave about it in the chat and got clarification that my original thought of it was correct. And no problem, I’m just happy I have a clearer definition of xFIP now.

Vote Up0Vote Down 
10 years ago
Jon
Guest
Jon
You can flag a comment by clicking its flag icon. Website admin will know that you reported it. Admins may or may not choose to remove the comment or block the author. And please don't worry, your report will be anonymous.

I messed this example up by the way, I meant to give the pitchers identical K and BB rates, ha.

Vote Up0Vote Down 
10 years ago
Jon
Guest
Jon
You can flag a comment by clicking its flag icon. Website admin will know that you reported it. Admins may or may not choose to remove the comment or block the author. And please don't worry, your report will be anonymous.

Ah ok, thanks for the clarification! Yikes, I can’t believe I had it wrong the whole time.

Vote Up0Vote Down 
10 years ago
Ben
Guest
Ben
You can flag a comment by clicking its flag icon. Website admin will know that you reported it. Admins may or may not choose to remove the comment or block the author. And please don't worry, your report will be anonymous.

Why can’t I type anything in the cells in the calculator?

Vote Up0Vote Down 
9 years ago
Freddy Turner
Member
Freddy Turner
You can flag a comment by clicking its flag icon. Website admin will know that you reported it. Admins may or may not choose to remove the comment or block the author. And please don't worry, your report will be anonymous.

I have been reviewing pitchers statistics for 2010 – 2011. I notice that their xFIP for that period is different than just for 2011. For instance, Jered Weaver has an xFIP of 3.42 for 2011 and 3.35 for the period 2010-11. Which is the one I should use when comparing him to other pitchers ? Is the 2011 a more current expectation and thus the better indicator ?

Vote Up-1Vote Down 
9 years ago
oakley sunglasses prescription
Guest
oakley sunglasses prescription
You can flag a comment by clicking its flag icon. Website admin will know that you reported it. Admins may or may not choose to remove the comment or block the author. And please don't worry, your report will be anonymous.

oakley sunglasses prescription
when it comes to quality. I have been using ABC for the last 3 years it never disappointed me. Does anybody know when the new version is coming out.

Vote Up-4Vote Down 
9 years ago
bradsilverman
Member
bradsilverman
You can flag a comment by clicking its flag icon. Website admin will know that you reported it. Admins may or may not choose to remove the comment or block the author. And please don't worry, your report will be anonymous.

The formula should have FB instead of FB%, right?

Vote Up1Vote Down 
8 years ago
BenH
Guest
BenH
You can flag a comment by clicking its flag icon. Website admin will know that you reported it. Admins may or may not choose to remove the comment or block the author. And please don't worry, your report will be anonymous.

It’s gotta be. Or else I’m just really confused.

Vote Up0Vote Down 
8 years ago
FredM
Guest
FredM
You can flag a comment by clicking its flag icon. Website admin will know that you reported it. Admins may or may not choose to remove the comment or block the author. And please don't worry, your report will be anonymous.

Totally agree with both of you:

Expected_HR = total_FB * league_average_HR/FB

So, where do I find total_FB??

Vote Up0Vote Down 
8 years ago
James Gentile
Member
Member
James Gentile
You can flag a comment by clicking its flag icon. Website admin will know that you reported it. Admins may or may not choose to remove the comment or block the author. And please don't worry, your report will be anonymous.

Yes. Totally it is FB not FB%. Steve screwed the pooch here.

Vote Up0Vote Down 
8 years ago
Xtremeline Baseball
Guest
Xtremeline Baseball
You can flag a comment by clicking its flag icon. Website admin will know that you reported it. Admins may or may not choose to remove the comment or block the author. And please don't worry, your report will be anonymous.

Very interesting statistic, not sure it can be utilized too often though.

Vote Up0Vote Down 
8 years ago
John
Guest
John
You can flag a comment by clicking its flag icon. Website admin will know that you reported it. Admins may or may not choose to remove the comment or block the author. And please don't worry, your report will be anonymous.

comment

Vote Up0Vote Down 
8 years ago
Adam Weinberger
Member
Member
Adam Weinberger
You can flag a comment by clicking its flag icon. Website admin will know that you reported it. Admins may or may not choose to remove the comment or block the author. And please don't worry, your report will be anonymous.

Hello, I am trying to use the xFIP formula but I have some questions. Is lg base 2 or base 10? (https://mathworld.wolfram.com/Lg.html).

Second, what is order or operations for lg HR/FB% ? If league average HR/FB% is 12.1% would I do lg(12.1) or lg(.121)?

Any help is appreciated. Thanks.

Vote Up0Vote Down 
8 months ago
You are going to send email to

Move Comment

Updated: Thursday, April 22, 2021 11:10 PM ETUpdated: 4/22/2021 11:10 PM ET
Player Linker - Contact Us - Advertise - Terms of Service - Privacy Policy
sis_logo
All major league baseball data including pitch type, velocity, batted ball location, and play-by-play data provided by Sports Info Solutions.
mlb logo
Major League and Minor League Baseball data provided by Major League Baseball.
Mitchel Lichtman
All UZR (ultimate zone rating) calculations are provided courtesy of Mitchel Lichtman.
TangoTiger.com
All Win Expectancy, Leverage Index, Run Expectancy, and Fans Scouting Report data licenced from TangoTiger.com
Retrosheet.org
Play-by-play data prior to 2002 was obtained free of charge from and is copyrighted by Retrosheet.