Sign In
  • Support FanGraphs
    FanGraphs Membership
    FanGraphs Shirts
    FanGraphs Mugs
    Gift a Membership
    Donate to FanGraphs
  • Fantasy
    Fantasy Tools
    2023 Fantasy Expert Rankings
    Auction Calculator
    Ottoneu Fantasy Baseball
    Signup, FAQ, Blog Posts
  • Blogs
    Blog Roll

    FanGraphs
    • Brooks Robinson (1937-2023), the Standard-Setter at Third Base
    • Effectively Wild Episode 2066: Moral Tarpitude
    • Ildemaro Vargas Makes Contact and Signs a Contract
    • Let's Get Small: Hundreds of Minor Leaguers Have Shrunk
    Podcasts: FanGraphs Audio | Effectively Wild | Chin Music

    FanGraphs Prospects

    RotoGraphs
    • The Sleeper and the Bust Episode: 1222 – Pitcher Flops in the Top 100 ADP
    • How A Rolling Chart Can Help Explain Your Season
    Podcasts: The Sleeper and The Bust | Field of Streams | Beat the Shift

    Community Research
    • Starting Pitchers Aren’t Leaning On Their Best Pitches

    Archived Blogs:The Hardball Times | NotGraphs | TechGraphs | FanGraphs+
    Archived THT:THT Live | Dispatch | Fantasy | ShysterBall
    Archived Podcasts:Stealing Home | Doing It For Bartolo | OttoGraphs | UMP: The Untitled McDongenhagen Project
  • Projections
    2023 Pre-Season Projections
    ZiPS, ZiPS DC
    Steamer
    Depth Charts
    ATC
    THE BAT, THE BAT X
    2023 600 PA / 200 IP Projections
    Steamer600, Steamer600 (Update)
    2023 Updated In-Season Projections
    ZiPS (RoS), ZiPS (Update), ZiPS DC (RoS)
    Steamer (RoS), Steamer (Update)
    Depth Charts (RoS)
    ATC DC (RoS)
    THE BAT (RoS), THE BAT X (RoS)
    3 Year Projections
    ZiPS 2024, ZiPS 2025
    On-Pace Leaders
    Every Game Played, Games Played %
    Cy Young Award Projections

    Auction Calculator
  • Scores
    Today
    Live Scoreboard, Probable Pitchers
    Live Daily Leaderboards
    Win Probability & Box Scores
    2023,2022, 2021, 2020, 2019, 2018, 2017...
    AL Games
    CLE (0) @ DET (0)Final
    TBR (7) @ TOR (7)Final/10
    BOS (0) @ BAL (0)Bot 7
    NYY (5) @ KCR (5)Bot 6
    SDP (6) @ CHW (6)Bot 8
    OAK (1) @ LAA (1)Bot 1
    TEX (5) @ SEA (5)Top 6
    NL Games
    PHI (3) @ NYM (3)Final
    MIA (6) @ PIT (6)Bot 8
    PHI (4) @ NYM (4)Bot 5
    CHC (10) @ MIL (10)Top 6
    CIN (5) @ STL (5)Top 6
    WSN (3) @ ATL (3)Bot 5
    HOU (1) @ ARI (1)Bot 4
    MIN (6) @ COL (6)Bot 4
    LAD (0) @ SFG (0)Top 2
  • Standings
    2023 Projected Standings
    2023 Playoff Odds, Playoff Odds Graphs
    ZiPS Postseason Game-By-Game Odds
    AL East
    AL Central
    AL West
    NL East
    NL Central
    NL West
  • Leaders
    Major League Leaders
    Batting: 2023, 2022, 2021, 2020, 2019, Career
    Pitching: 2023, 2022, 2021, 2020, 2019, Career
    Fielding: 2023, 2022, 2021, 2020, 2019, Career
    Splits Leaderboards
    Season Stat Grid
    60-Game Span Leaderboards (Special)

    KBO Leaders
    Batting, Pitching

    Minor League Leaders
    AAA: International League, Pacific Coast League
    AA: Eastern League, Southern League, Texas League
    A+: Midwest League, South Atlantic League, Northwest League
    A: California League, Carolina League, Florida State League
    CPX: Arizona, Florida
    R: Dominican Summer League
    Legacy Minor League Leaderboards

    WAR Tools
    Combined WAR Leaderboards
    WAR Graphs
    WPA Tools
    WPA Inquirer
    Rookie Leaders
    Batters 2023, Pitchers 2023
    Splits Leaders
    Batters: vs L, vs R, Home, Away
    Pitchers: vs L, vs R, Home, Away
  • Teams
    Team Batting Stats
    2023, 2022, 2021, 2020, 2019, 2018...
    Team Pitching Stats
    2023, 2022, 2021, 2020, 2019, 2018...
    Team WAR Totals (RoS)
    AL East
    Blue Jays  |  DC
    Orioles  |  DC
    Rays  |  DC
    Red Sox  |  DC
    Yankees  |  DC
    AL Central
    Guardians  |  DC
    Royals  |  DC
    Tigers  |  DC
    Twins  |  DC
    White Sox  |  DC
    AL West
    Angels  |  DC
    Astros  |  DC
    Athletics  |  DC
    Mariners  |  DC
    Rangers  |  DC
    NL East
    Braves  |  DC
    Marlins  |  DC
    Mets  |  DC
    Nationals  |  DC
    Phillies  |  DC
    NL Central
    Brewers  |  DC
    Cardinals  |  DC
    Cubs  |  DC
    Pirates  |  DC
    Reds  |  DC
    NL West
    D-backs  |  DC
    Dodgers  |  DC
    Giants  |  DC
    Padres  |  DC
    Rockies  |  DC
    Positional Depth Charts
    Batters: C, 1B, 2B, SS, 3B, LF, CF, RF, DH
    Pitchers: SP, RP
  • RosterResource
    Current Depth Charts
    AL East
    Blue Jays
    Orioles
    Rays
    Red Sox
    Yankees
    AL Central
    Guardians
    Royals
    Tigers
    Twins
    White Sox
    AL West
    Angels
    Astros
    Athletics
    Mariners
    Rangers
    NL East
    Braves
    Marlins
    Mets
    Nationals
    Phillies
    NL Central
    Brewers
    Cardinals
    Cubs
    Pirates
    Reds
    NL West
    D-backs
    Dodgers
    Giants
    Padres
    Rockies
    In-Season Tools
    2023 Closer Depth Chart
    2023 Injury Report
    2023 Lineup Tracker
    2023 Payroll Pages
    2023 Probables Grid
    2023 Schedule Grid
    2023 Transaction Tracker
    2023 Minor League Power Rankings
    Offseason Tools
    2023 Opening Day Tracker
    2023 Offseason Tracker
    2023 Free Agent Tracker
  • Prospects
    Prospects Home
    The Board
    The Board: Scouting + Stats!
    How To Use The Board: A Tutorial
    Farm System Rankings

    Top Prospects List
    20232022
    AL
    BALCHWLAA
    BOSCLEOAK
    NYYDETSEA
    TBRKCRTEX
    TORMINHOU
    NL
    ATLCHCARI
    MIACINCOL
    WSNMILLAD
    NYMPITSDP
    PHISTLSFG
    2023 Preseason Top 100
  • Glossary
    Library
    Batting Stats
    wOBA, wRC+, ISO, K% & BB%, more...
    Pitching Stats
    FIP, xFIP, BABIP, K/9 & BB/9, more...
    Defensive Stats
    UZR Primer, DRS, FSR, TZ & TZL, more...
    More
    WAR, UBR Primer, WPA, LI, Clutch
    Guts!
    Seasonal Constants
    Park Factors
    Park Factors by Handedness
  • Sign In
  • Intro
  • Features
  • Offense
    • Complete List (Offense)
    • OBP
    • OPS and OPS+
    • wOBA
    • wRC and wRC+
    • wRAA
    • Off
    • BsR
    • UBR
    • wSB
    • wGDP
    • BABIP
    • ISO
    • HR/FB
    • Spd
    • Pull%/Cent%/Oppo%
    • Soft%/Med%/Hard%
    • GB%, LD%, FB%
    • K% and BB%
    • Plate Discipline (O-Swing%, Z-Swing%, etc.)
    • Pitch Type Linear Weights
    • Pace
  • Defense
    • Overview
    • Def
    • UZR
    • DRS
    • Defensive Runs Saved – 2020 Update
    • Inside Edge Fielding
    • Catcher Defense
    • FSR
    • RZR
    • TZ / TZL
  • Pitching
    • Complete List (Pitching)
    • PitchingBot Pitch Modeling Primer
    • Stuff+, Location+, and Pitching+ Primer
    • ERA
    • WHIP
    • FIP
    • xFIP
    • SIERA
    • Strikeout and Walk Rates
    • Pull%/Cent%/Oppo%
    • Soft%/Med%/Hard%
    • GB%, LD%, FB%
    • BABIP
    • HR/FB
    • LOB%
    • Pitch Type Linear Weights
    • SD / MD
    • ERA- / FIP- / xFIP-
    • Plate Discipline (O-Swing%, Z-Swing%, etc.)
    • Pace
    • PITCHF/x
      • What is PITCHF/x?
      • Pitch Type Abbreviations & Classifications
      • Heat Maps
      • Common Mistakes
      • PITCHf/x Resources
  • WE/RE/LI
    • RE24
    • Win Expectancy
    • WPA
    • LI
    • WPA/LI
    • Clutch
  • Principles
    • DIPS
    • Regression toward the Mean
    • Replacement Level
    • Sample Size
    • Splits
    • Projection Systems
    • Linear Weights
    • Counting vs. Rate Statistics
    • Park Factors
    • Park Factors – 5 Year Regressed
    • Positional Adjustment
    • Aging Curve
    • League Equivalencies
    • Pythagorean Win-Loss
    • Luck
  • WAR
    • What is WAR?
    • WAR for Position Players
    • WAR for Pitchers
    • FDP
    • fWAR, rWAR, and WARP
    • WAR Misconceptions
  • Business

Author Archive

Calculating Pitcher WAR, A Complete Example

by Neil Weinberg
April 17, 2017

One of the hallmark statistics available at FanGraphs is Wins Above Replacement (WAR) and we’ve just rolled out an updated Library entry that spells out the precise calculations for pitchers in more detail than ever before. There’s always been a clear sense of the the kinds of things that go into our WAR calculation, but until this point finding the specific formula for pitcher WAR has been a little complicated.

As of today, we’ve resolved that and I encourage you to go check out our basic primer on WAR and our detailed breakdown of how we calculate it for pitchers. If you’re a hands-on learner, grab a pen and paper or spreadsheet and follow along. I’m going to walk you through a complete example of how to calculate WAR for pitchers. Let’s use the 2016 version of Marcus Stroman as our exemplar. Please note that I will being rounding off certain numbers in the example to keep the page as neat as possible, so if you wind up being off by 0.1 WAR or so, don’t sweat it.

See also: Position Player Formula | Position Player Example
Read the rest of this entry »


The Beginner’s Guide To Understanding Descriptive and Predictive Stats

by Neil Weinberg
October 27, 2016

Baseball statistics are designed to answer questions. Some questions are simple, such as “who reached base most often in 2016?” while others are more complicated, like “who was the best base runner in the American League?” Statistics allow us to gather up data points from individual events and summarize them in ways that are easy to understand.

Different statistics answer different questions and therefore have different uses. You can’t figure out who the best hitter is solely by looking at his batting average. Batting average tells you something, but batting average itself answers a very specific and limited question. Over the years, we’ve attempted to expand the statistics we use to better capture the game we love. Instead of batting average, we moved to OBP, then OPS, then wOBA, and so on. The key is to decide on your question and then find which available statistic(s) best answers that question.

One issue that comes up regularly is whether a statistic is predictive of the future or merely descriptive. You’ve likely heard that FIP is a better predictor of future ERA than current ERA. For this reason, many people believe that FIP was designed as a predictive statistic. As I discuss here, that is not accurate, but the perception persists because FIP is useful for prediction.

Read the rest of this entry »


The Beginner’s Guide To Splits

by Neil Weinberg
August 2, 2016

One fundamental aspect of baseball is how well you can describe every situation. With modern technology, this is becoming true of every sport, but the ability to categorize baseball stretches far back into history. We don’t have batted-ball type from 1951, but we know who was batting and pitching, the number of outs and base runners, the inning, the score, the park, and loads of other information for every plate appearance. The data gets better as we approach the present day, but organizing the game based on a collection of variables has a long history.

Want to know how well a batter hit against left-handed pitchers at home in 2004? That’s a question we can answer using something commonly known as “splits.” Some splits, such as handedness splits, are particularly meaningful. Others, such as day of the week splits, are entirely trivial. The compartmentalized nature of baseball, in which individual events occur in an orderly fashion, allows us to record tons of data and then sort it later however we choose.

This post covers basic information you will want to know as you dive into this realm of baseball data. If you’re an advanced consumer of baseball statistics, you probably won’t find a ton of information that’s new to you.

Read the rest of this entry »


The Beginner’s Guide To Using FanGraphs Shift Data

by Neil Weinberg
June 17, 2016

Earlier this year, FanGraphs began carrying shift data compiled by our friends at Baseball Info Solutions. With shifting on the rise every year, this kind of information has become more and more vital to fans and analysts. This posts walks you through how to access and use the data available on FanGraphs.

First, let’s start by describing what data is available. We have pitcher and hitter shift data going back to 2010 that is viewable on the leaderboards (for players, teams, and league) and player splits pages. The data exists for balls in play only (non-home run batted balls), so if a team shifts mid-plate appearance we only have the alignment for the final pitch. This also means we don’t have data for walks, hit batters, strikeouts, and home runs. If you want to know about how well a team deploys the shift while on defense, you want to look at pitchers. If you want to know about which hitters get shifted against, you want to look at hitters.

Read the rest of this entry »


FIP May Look Like ERA, But It’s Designed Like wOBA

by Neil Weinberg
May 11, 2016

If you have at least a passing familiarity with sabermetrics, you’ve probably heard something like this: Fielding Independent Pitching (FIP) is what a pitcher’s ERA should have been based on his walks, hit batters, strikeouts, and home runs. In other words, FIP is described as a predictive tool to tell you what should have happened rather than as a retrospective assessment of actual pitcher performance.

But this is wrong. This is a shorthand way of describing FIP that well-meaning analysts (myself included) have used, but I’ve come to realize that by aiming to put FIP in terms of ERA, we’ve actually made it more difficult for people to grasp and embrace what FIP is really telling us. It’s time to change the way we talk about FIP, because while the concept of defense independent stats has gained popularity, there is often push back (by some) against FIP as a measure of value, in part, because of less than ideal presentation.

Read the rest of this entry »


The Beginner’s Guide To Deriving wOBA

by Neil Weinberg
April 11, 2016

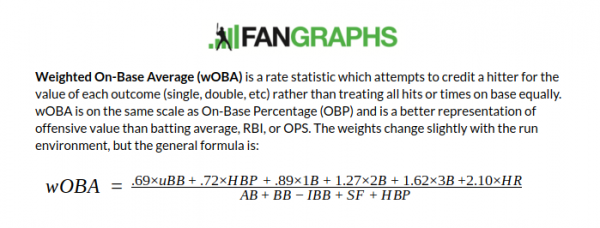
We feature many statistics on FanGraphs, but one of the most fundamental is Weighted On-Base Average (wOBA). If you’re not familiar with the merits of wOBA in general, I invite you to head over to our full library page on it or to learn about why it’s a gateway sabermetric statistic. For our purposes, I’ll simply include the summary:

wOBA flash

wOBA is designed to weigh the different offensive results by their actual average contribution to run scoring. Batting average treats all hits equally and ignores walks. OBP treats all times on base equally. Slugging percentage weighs hits based on the number of bases achieved but ignores walks. Adding OBP and SLG is better than any one of AVG/OBP/SLG, but it still isn’t quite right.

Hitting a single and drawing a walk are both positive outcomes, but they have a different impact on the inning. A walk always moves each runner up one base while a single could have a variety of outcomes depending on who is on base and where the ball is hit. We want a statistic that captures that nuance.

Granted, wOBA doesn’t adjust for park, league, quality of competition, or a number of other factors, but it’s a good starting point on which to build. So how do we take the beautiful chaos of baseball and create the formula listed above?

The exact numbers are going to change each year based on the run environment (how many runs are being scored league wide), but they are consistent enough that we won’t have any problems understanding each other. I’m going to use the 2015 data, but you can view every year here. Allow me to bring a chunk of that table into this post for convenience:

Seasonal Constants
Season wOBA wOBAScale wBB wHBP w1B w2B w3B wHR runSB runCS R/PA R/W cFIP
2015 .313 1.251 .687 .718 .881 1.256 1.594 2.065 .200 -.392 .113 9.421 3.134
2014 .310 1.304 .689 .722 .892 1.283 1.635 2.135 .200 -.377 .108 9.117 3.132
2013 .314 1.277 .690 .722 .888 1.271 1.616 2.101 .200 -.384 .110 9.264 3.048
2012 .315 1.245 .691 .722 .884 1.257 1.593 2.058 .200 -.398 .114 9.544 3.095
2011 .316 1.264 .694 .726 .890 1.270 1.611 2.086 .200 -.394 .112 9.454 3.025
2010 .321 1.251 .701 .732 .895 1.270 1.608 2.072 .200 -.403 .115 9.643 3.079

You can ignore the last four columns for the purposes of wOBA, but this is a truncated version of our Guts! page and shows us each year’s league wOBA, the wOBA scale, and the weights for each of our six offensive events of interest. Hopefully those numbers will look similar to the wOBA equation you saw earlier.

Our ultimate goal is to create a statistic that measures each offensive action’s context neutral contribution to run scoring because scoring runs is the currency of baseball. We have decided that we want to measure walks, HBP, singles, doubles, triples, and home runs. If you wanted to, you could build wOBA with more nuanced stats like fly ball outs, ground outs, strikeouts, etc; it would just get more complicated without much added value.

We have a specific goal and the set of offensive actions we want to measure, but now we need a method of putting them together.

Run Expectancy

The first thing we need is a run expectancy matrix. If you need a complete introduction to the concept, head over to this page. In general, run expectancy measures the average number of runs scored (through the end of the current inning) given the current base-out state.

Base-out states are a record of the number of outs (0, 1, or 2) and how many runners are on base and where (no one on, man on 1B, men on 1B and 3B, etc). There are three out-states and eight base-states, meaning that there are 24 base-out states. Each plate appearance has a base-out state.

Let’s use one out, man on first as our example. In order to calculate the run expectancy for that base-out state, we need to find all instances of that base-out state from the entire season (or set of seasons) and find the total number of runs scored from the time that base-out state occurred until the end of the innings in which they occurred. Then we divide by the total number of instances to get the average. If you do the math using 2010-2015, you get 0.509 runs. In other words, if all you knew about the situation was that there was one out and a man on first, you would expect there to be .509 runs scored between that moment and the end of the inning on average.

You repeat the process for the other 23 base-out states and wind up with a table like this:

Run Expectancy Matrix 2010-2015
Runners 0 outs 1 outs 2 outs
__ __ __ 0.481 0.254 0.098
1B __ __ 0.859 0.509 0.224
__ 2B __ 1.100 0.664 0.319
1B 2B __ 1.437 0.884 0.429
__ __ 3B 1.350 0.950 0.353
1B __ 3B 1.784 1.130 0.478
__ 2B 3B 1.964 1.376 0.580
1B 2B 3B 2.292 1.541 0.752
SOURCE: Tom Tango

The table listed here was calculated by Tom Tango using 2010-2015 data for the entire league and serves as a good baseline. At FanGraphs, we park adjust the matrix for each game, so the exact numbers might be a touch different if you’re trying to play along at home in excruciating detail.

Linear Weights

Now that you have a run expectancy matrix, you need to learn how to use it. Each plate appearance moves you from one base-out state to another. So if you walk with a man on first base and one out, you move to the “men on first and second and one out” box. That box has an RE value of 0.884. Because your plate appearance moved you from .509 to 0.884, that PA was worth +0.375 in terms of run expectancy.

Every plate appearance has one of these values, either positive or negative. You can learn more about this by following the earlier link.

What we want to determine is the average run value of a walk, HBP, single, double, triple, and home run. To do this, we take the total RE value of all walks (unintentional in this case), for example, and divide that number by the number of walks in that season. You’re going to wind up getting something around 0.3. You repeat this for the other five actions. This gives you the runs above average produced by each of these kinds of events.

In theory, we could essentially be done right now because we have everything we need to build a statistic that will weigh the offensive actions properly. However, the inventors of wOBA decided that it would probably be best to scale it to something familiar to make it easier to understand. And they picked OBP.

Scaling

We have the runs above average for walks (0.29), HBP (0.31), singles (0.44), doubles (0.74), triples (1.01), and home runs (1.39), but what we want to do now is put wOBA on a scale that will look like OBP. In OBP, an out is worth zero, so the first thing we want to do is adjust the run value scale so that an out is equal to zero.

There is an easy way to do this. First, we need to find the linear weight for all outs using the same method we used to find the value for the other events. We’ll call it -0.26 for 2015. This means that an out is worth -0.26 runs less than the average PA when it comes to run expectancy. What we want to do now is add 0.26 to each of our run values so that outs are equal to zero. So for walks, which we said are worth 0.29 runs above average, we bump those up to 0.55 runs relative to an out. Using linear weights, walks are worth 0.55 runs more than outs. We repeat this for each of the five other positive offensive outcomes.

2015 Linear Weights (Relative To Outs)
Event Run Value
BB 0.55
HBP 0.57
1B 0.70
2B 1.00
3B 1.27
HR 1.65

As you’ll notice, these are not the weights you saw in the wOBA equation. We’re not done scaling them yet. We know that we want BB, HBP, 1B, 2B, 3B, and HR in the numerator of the wOBA formula and plate appearances (minus weird stuff like sac bunts) in the denominator, so what we’re going to do is calculate “wOBA” for the entire league using the linear weights in this table and the total number of events of each type.

In other words, we’re gong to multiply 0.55 times the number of walks in MLB in 2015 and add that to 0.57 times the number of HBP and so on, and then divide the entire sum by the number of plate appearances (really AB + BB – IBB + SF +HBP). If we do that, we wind up with 0.250.

But remember that we want wOBA to look like OBP. So we need to scale the entire thing so that the league’s wOBA is .313 (to match OBP with IBB removed). To do that, we divide .313/.250 and get 1.251, which we call the wOBA Scale.

We take the wOBA Scale and multiply it against the linear weights from the table above and viola, we have ourselves the weights listed in the wOBA equation. And we’re done!

Concluding Thoughts

It’s important to remember that wOBA is one implementation of a linear weights based offensive metric. Baseball Prospectus has their own version, True Average, which is based on the same pillars and implemented differently. Choosing to scale it to OBP is an aesthetic choice. We could scale it to batting average or to nothing. The important part is just that we understand the scale we’re using.

The main idea is that we’re giving each type of outcome a value based on the average change in run expectancy that particular outcome yields. The idea is to give the right amount of credit to each kind of event. Doing so does not make wOBA a perfect statistic, it simply makes it a better one than the traditional AVG/OBP/SLG.

There are lots of little nuances you can add to something like wOBA to get it closer and closer to the truth. All we’re doing here is creating the foundation for all of that work.


How To Use FanGraphs: Spray Charts

by Neil Weinberg
March 17, 2016

Once upon a time, all we had were box scores. We might know a player went 1-3 with a double and a walk, but we wouldn’t know how exactly all of the game’s events unfolded. We’ve come a long way since then, getting play-by-play data, pitch-by-pitch data, video tracking, PITCHf/x, and Statcast. We have results data stretching back more than a century, but the way those results came about gets easier to understand with new information.

What direction was the double hit? How far did it go? Who fielded it? Hearing a player hit a double seems like specific information, but there’s plenty more you might want to know about that event. One of the ways we communicate that information is through Spray Charts.

There are certainly other ways to communicate information of this nature, but one implementation is to display it visually on a diamond graphic and you can find our implementation of spray charts on the player pages here at FanGraphs.

Read the rest of this entry »


A Place To Learn About Sabermetrics

by Neil Weinberg
February 18, 2016

Pitchers and catchers are reporting for Spring Training this week and, before you know it, there will be real, live baseball happening in Arizona and Florida. As the season approaches, I’d like to take a little time to welcome any statistical newcomers to the FanGraphs Library.

If you’ve made it this far, you’ve almost certainly read articles on the main site, visited some of our player pages or leaderboards, or played our fantasy baseball game, Ottoneu. But what you might not know is that we have an entire section of the site devoted to helping you get the most out of the information housed at FanGraphs.

The most well-known components of the Library are detailed descriptions of the statistics available at the site. These pages are written presuming no previous knowledge of sabermetrics, statistical theory, or mathematics. If you understand the rules of the game, you’ll have no trouble following along. For example, if you come across “wOBA” in an article or on one of the stat pages and have no idea that it stands for, our Library entry is here to help. Not only can you find a basic description of that stat, but there is also a detailed breakdown of how to calculate it, how to use it, why it is important, and all sorts of other information that will help you get more out of the site.

Read the rest of this entry »


Basic Principles of Free Agent Contract Evaluation

by Neil Weinberg
January 14, 2016

While it’s January and many free agents have decided where they will be playing in 2016 and beyond, there are still some notable players without new teams. One thing I’m struck by each offseason is how frequently some people comment on new contracts without a good grasp of how teams and players settle on a term of years and dollars. In particular, it’s common to hear these comments from pundits and fans who aren’t quite as plugged into the game as regular readers of sites like FanGraphs.

So for the new reader, or the old one looking to explain the finer points to their friends, here are some basic principles about free agent contracts to remember when thinking about their prudence.

Read the rest of this entry »


The Beginner’s Guide To Aging Curves

by Neil Weinberg
December 10, 2015

This time of year is about roster decisions. Teams are working to build their 2016 rosters with an eye on how 2016 fits into their overall plan. Some teams are looking at their current roster and payroll and deciding to go for it, while others are setting themselves up for a bright future. Clubs are making trades and signing free agents, and from the outside, we’re trying to figure out which moves are good and which aren’t.

There are a lot of factors that go into evaluating a particular transaction or set of transactions. Far too many to talk about all at once. But we can generally agree that our attempt to forecast future player performance is central to any effort. In order to know if the Cubs made a smart move in signing Ben Zobrist, we need to develop some prediction about how good Zobrist will be over the life of his four-year deal. Obviously, this is a tricky business.

We are trying to project Zobrist’s future. We’ve talked about projections in this space before. They are estimates of true talent, adjusted for aging. You can read more about the basics here, but this article will focus on the aging component. In order to make decisions about players, we need to know how good they are presently and how those skills will improve or decline in the future.

Read the rest of this entry »


« Previous entries
Next Page »

Updated: Saturday, September 30, 2023 10:37 AM ETUpdated: 9/30/2023 10:37 AM ET
@fangraphs - Contact Us - Advertise - Terms of Service - Privacy Policy
sis_logo
All major league baseball data including pitch type, velocity, batted ball location, and play-by-play data provided by Sports Info Solutions.
mlb logo
Major League and Minor League Baseball data provided by Major League Baseball.
Mitchel Lichtman
All UZR (ultimate zone rating) calculations are provided courtesy of Mitchel Lichtman.
TangoTiger.com
All Win Expectancy, Leverage Index, Run Expectancy, and Fans Scouting Report data licenced from TangoTiger.com
Retrosheet.org
Play-by-play data prior to 2002 was obtained free of charge from and is copyrighted by Retrosheet.